TUTORIAL
Streamlit Tutorial for Data Scientists
You can add Streamlit to your project in just a few minutes. In this tutorial, we'll show you how to get started with Streamlit and turn your Python project into a fully-functional, interactive app.
Streamlit is an open-source Python library that makes it easy to build beautiful, interactive data apps in only a few lines of code. In order to publish your model on Health Universe, it must include Streamlit, to give users an interface to interact with your model. In this article, we'll show you how to get started with Streamlit and turn your Python project into a fully-functional, interactive app.
First, make sure you have Streamlit installed. You can do this by running the following command:
command linepip install streamlit
Next, create a new Python file for your Streamlit app. Import the necessary libraries, including Streamlit, and add some simple text.
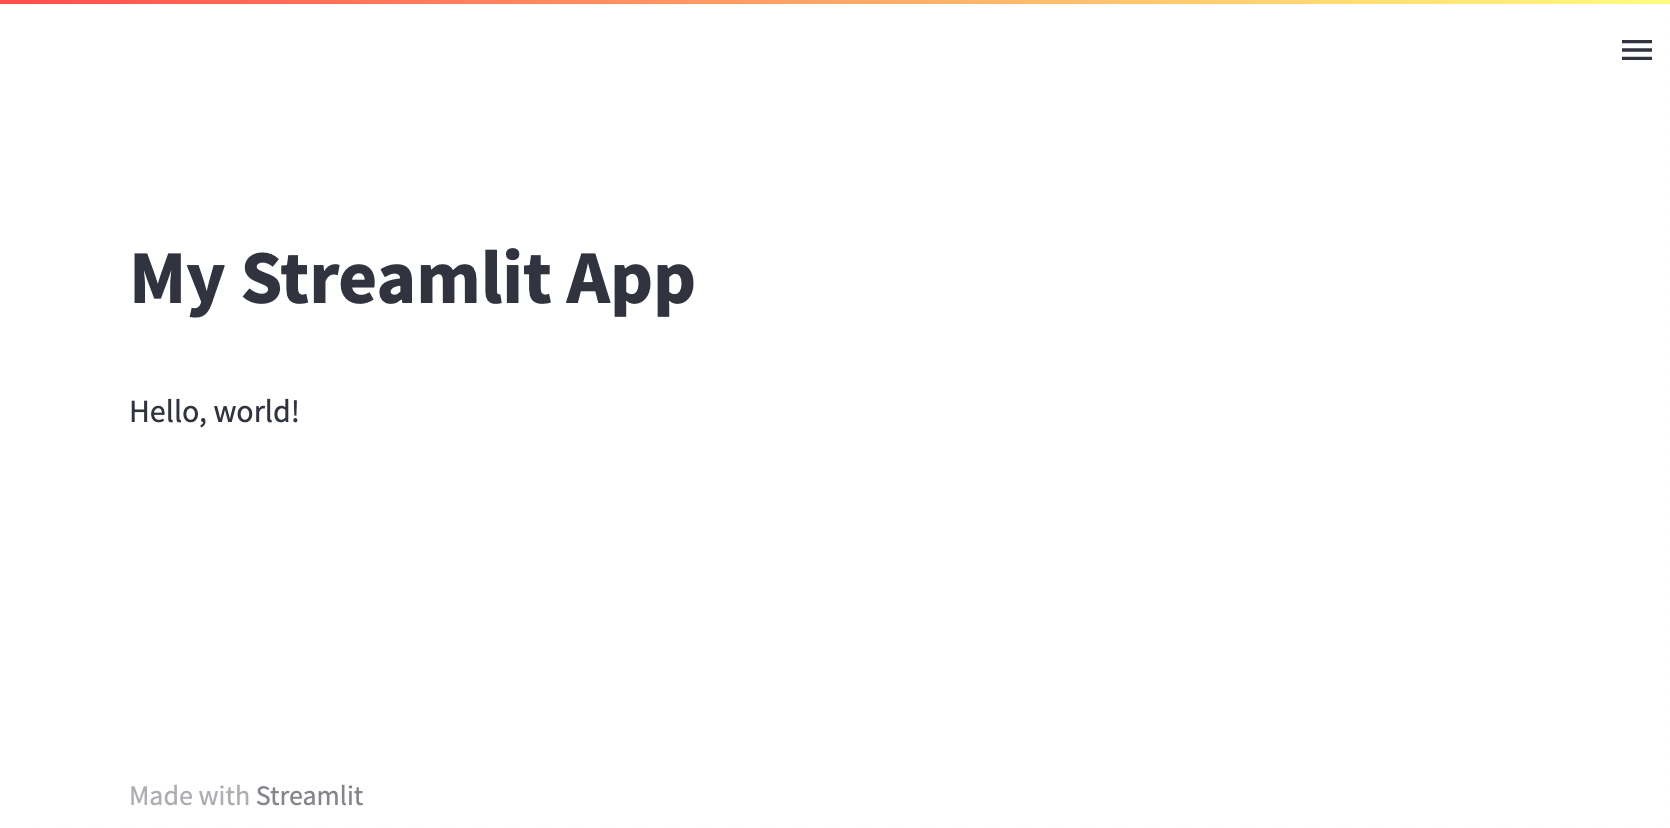
my_app.pyimport streamlit as st

st.title("My Streamlit App")
st.write("Hello, world!")
Next, you can run your app from the terminal using the streamlit run my_app.py command. This will launch a server for you to access the app via your web browser.
command linestreamlit run my_app.py

You can now view your Streamlit app in your browser.

Local URL: http://localhost:8501
Network URL: http://192.168.4.30:8501
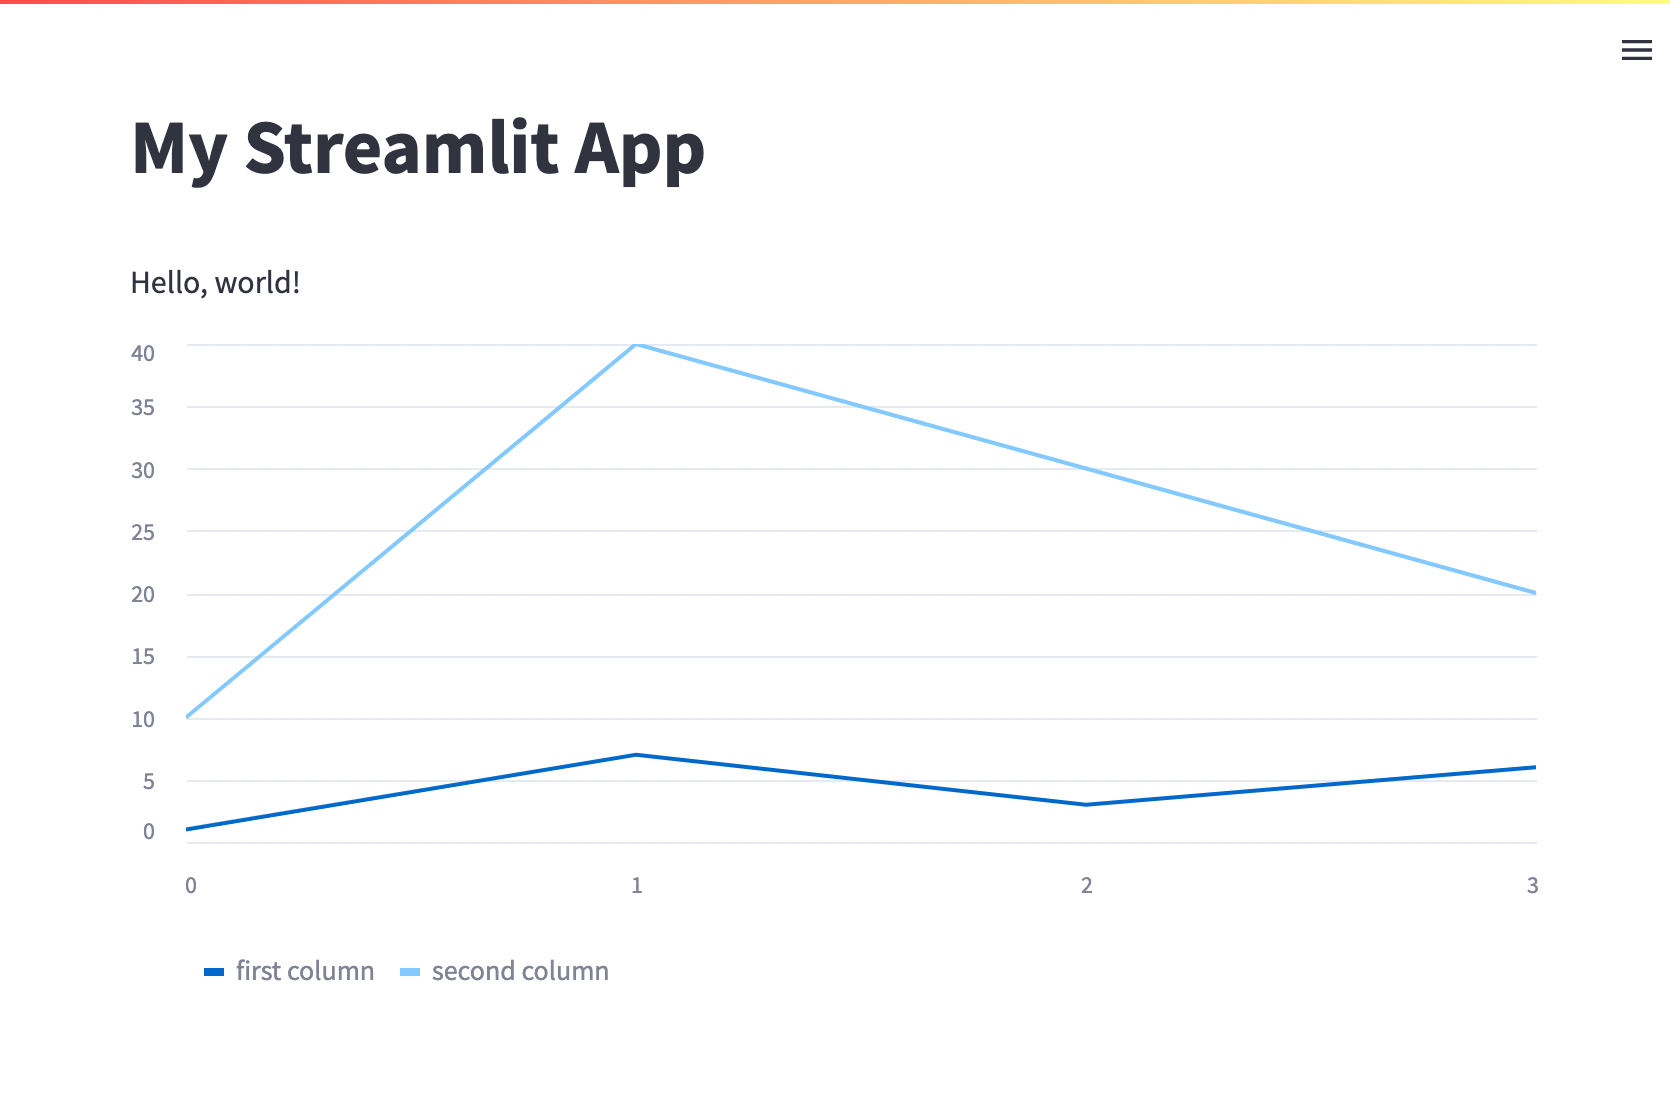
Now, you can add your existing Python code to the app by wrapping it in Streamlit functions. For example, if you have a data you want to include in the app, you can use a pandas DataFrame object and pass it into a streamlit line_chart.
my_app.pyimport streamlit as st
import pandas as pd

st.title("My Streamlit App")
st.write("Hello, world!")

pd = pd.DataFrame({
    'first column': [1, 7, 3, 6],
    'second column': [10, 40, 30, 20]
})

st.line_chart(pd)
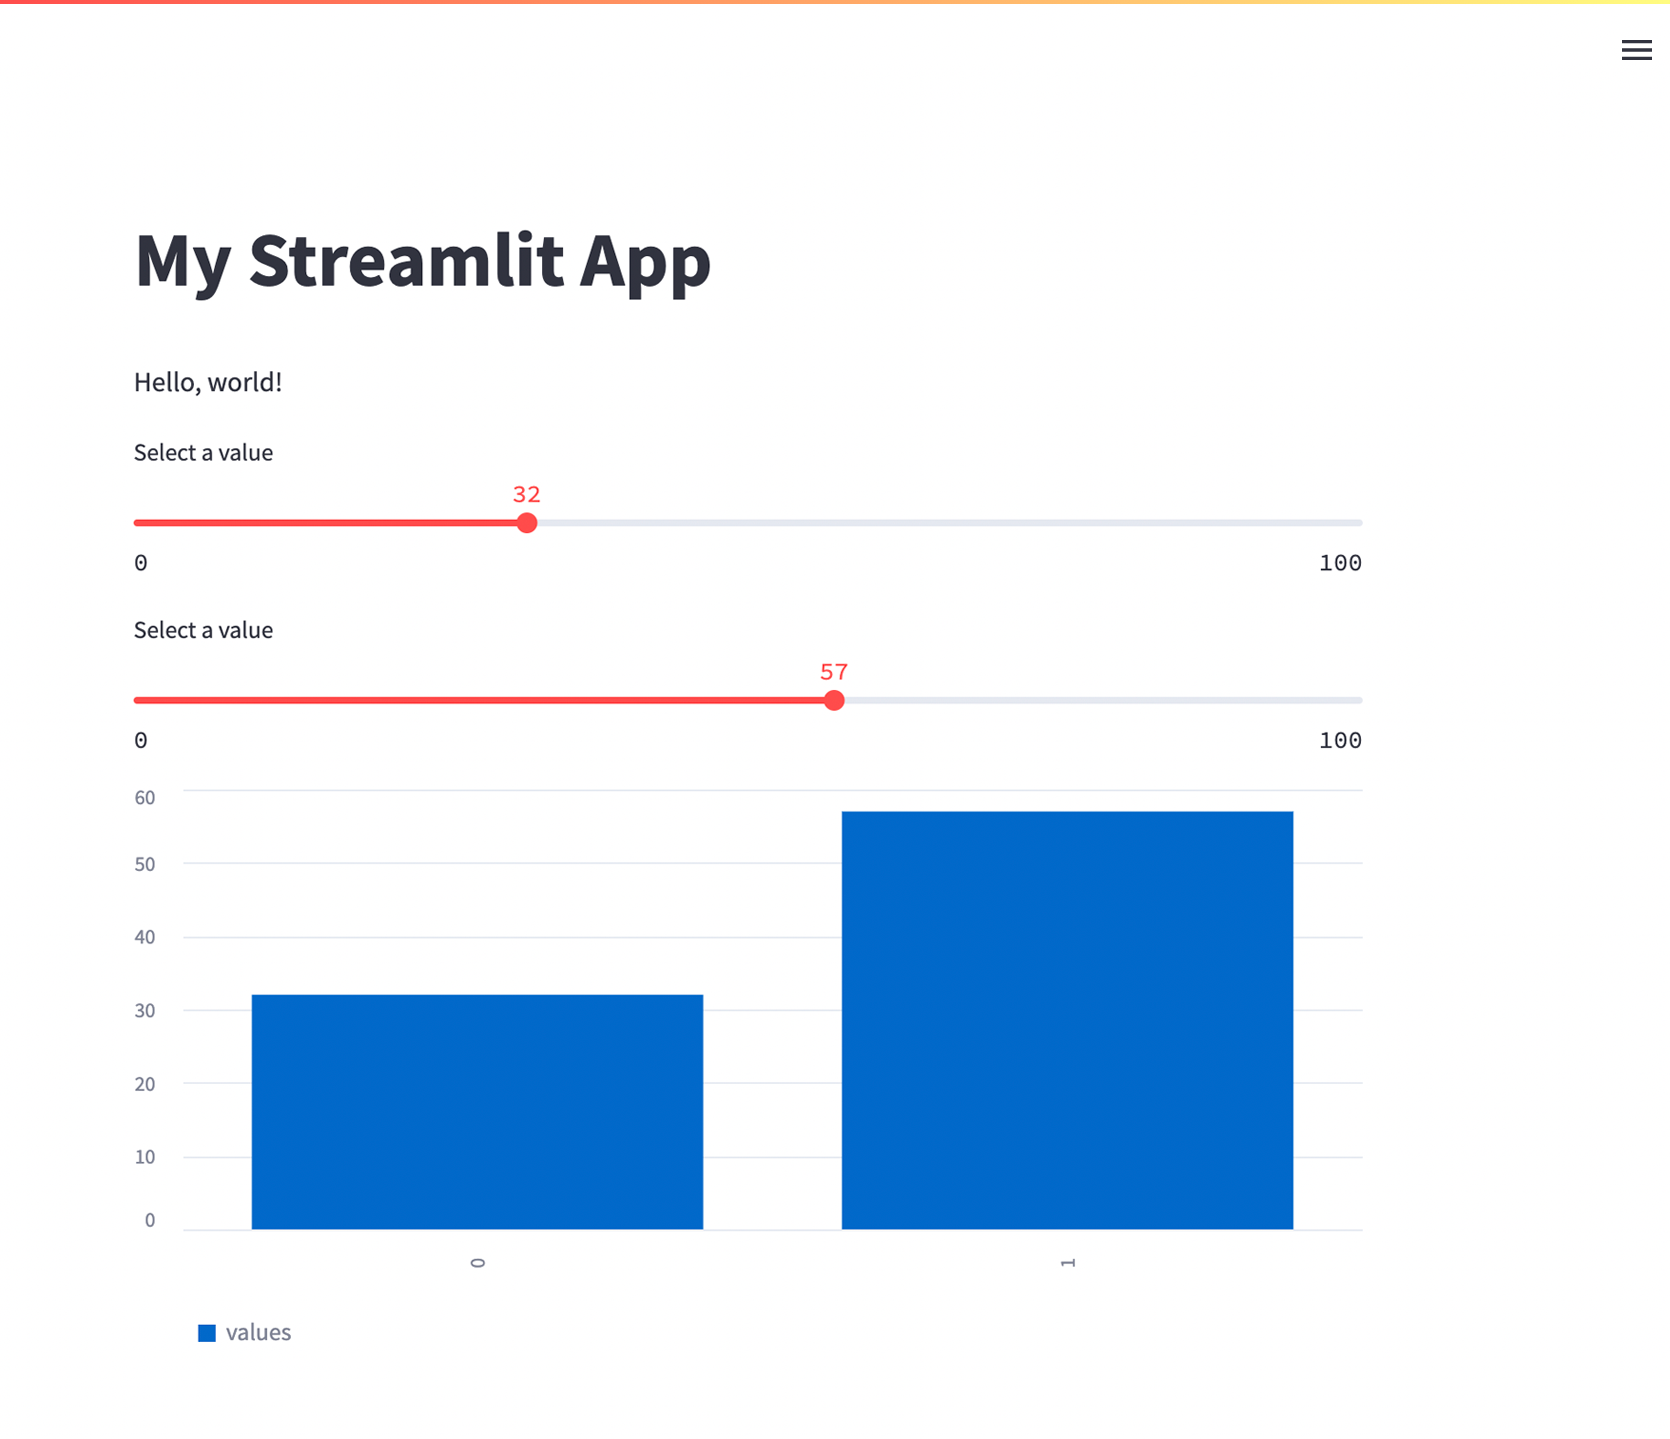
You can also add interactive elements to your app, such as sliders and buttons, using Streamlit's built-in widgets. For example, the following code creates two sliders that allows the user to adjust the value of a variable in real-time. Let's also try a bar chart:
my_app.pyimport streamlit as st
import pandas as pd

st.title("My Streamlit App")
st.write("Hello, world!")

value1 = st.slider("Select a value", key="value1")
value2 = st.slider("Select a value", key="value2")

pd = pd.DataFrame({
    'values': [value1, value2],
})

st.bar_chart(pd)
And that's it! You now have a fully-functional Streamlit app that showcases your Python project in an interactive, user-friendly way. For more information on Streamlit and all the possibilities it offers, check out the official documentation. Happy app-building!